22. Parametric Surfaces and Surface Integrals
b. Tangent and Normal Vectors
1. Coordinate Curves
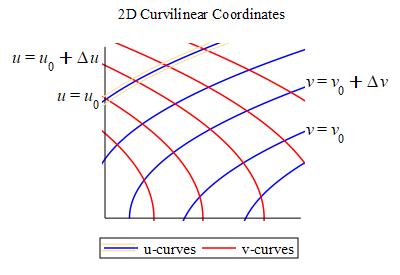
For a 2D curvilinear coordinate system \(\vec R(u,v)\), the coordinate curves (the \(u\)-curves and \(v\)-curves) are obtained by holding one coordinates fixed while the other coordinate changes. \(u\) changes on a \(u\)-curve. \(v\) changes on a \(v\)-curve.
In the figure the blue curves are the \(u\)-curves and the red curves are the \(v\)-curves.
For a parametric surface, \(\vec R(u,v)\), the
coordinate curves (the \(u\)-curves and
\(v\)-curves) are obtained by holding one coordinate fixed while the
other coordinate changes. \(u\) changes on a \(u\)-curve. \(v\) changes
on a \(v\)-curve.
The \(u\)-curve with \(v=v_0\) and parameter \(u\) is:
\[
\vec R(u,v_0)=\left\langle x(u,v_0),y(u,v_0),z(u,v_0)\right\rangle
\]
The \(v\)-curve with \(u=u_0\) and parameter \(v\) is:
\[
\vec R(u_0,v)=\left\langle x(u_0,v),y(u_0,v),z(u_0,v)\right\rangle
\]
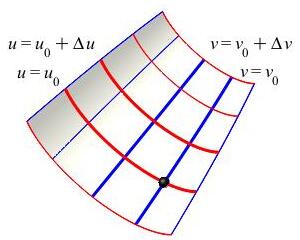
In the figure the blue curves are the \(u\)-curves and the red curves are the \(v\)-curves.
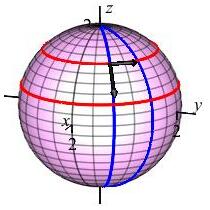
Identify the coordinate curves for the sphere of radius \(\rho=2\), parametrized by \[ \vec R(\phi,\theta) =\left\langle 2\sin\phi\cos\theta,2\sin\phi\sin\theta,2\cos\phi\right\rangle \]
A \(\phi\)-curve is a line of longitude (in blue) increasing from the North pole to the South pole with a constant value of \(\theta\). A \(\theta\)-curve is a line of latitude (in red) increasing from West to East with a constant value of \(\phi\).
Identify the coordinate curves for the paraboloid \(z=\dfrac{x^2+y^2}{5}\) parametrized by \(\vec R(r,\theta) =\left\langle r\cos\theta,r\sin\theta,\dfrac{r^2}{5}\right\rangle\).
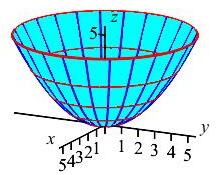
The \(r\)-curves are the parabolas (in
blue).
The \(\theta\)-curves are the circles (in
red).
An \(r\)-curve is a parabola (in blue) starting at the vertex of the paraboloid and increasing up a side with a constant value of \(\theta\). A \(\theta\)-curve is a circle (in red) increasing counterclockwise around the paraboloid with a constant value of \(r\).
Notice the boundary curves affect the choice of parametrization, but they do not affect the coordinate curves.
Heading
Placeholder text: Lorem ipsum Lorem ipsum Lorem ipsum Lorem ipsum Lorem ipsum Lorem ipsum Lorem ipsum Lorem ipsum Lorem ipsum Lorem ipsum Lorem ipsum Lorem ipsum Lorem ipsum Lorem ipsum Lorem ipsum Lorem ipsum Lorem ipsum Lorem ipsum Lorem ipsum Lorem ipsum Lorem ipsum Lorem ipsum Lorem ipsum Lorem ipsum Lorem ipsum